The Author:
Dr. Rainer Petschick
Geologisch-Paläontologisches Institut
Johann Wolfgang Goethe-Universität Frankfurt am
Main
Senckenberganlage 32-34
60054 Frankfurt am Main
Germany
Tel. 069-798 22694
Fax. 069-798 22958
e-mail:
[email protected]
MacDiff is continuously in developement.
If you observe any bug, or if you miss a special feature,
please let me here!
|
System requirements:
PowerMac PPC version:
Power Macintosh with min. 2 MB RAM hard disk space, colored
monitor (min. 256 colors, 14 inch, better 17 inch), about
2.0 MB free RAM, System 7.1 or 7.5.
68K version:
Macintosh or Powerbook with 68030 processor, better 68040,
16 colors, 12 inch monitor, about 2 MB on harddisk, 2.5 MB
free RAM, System 7.x.
A PowerMac is recommended for best
performance!
|
The software is written in Visual Interactive
Programming (VIP)-BASIC, a development tool of
Mainstay.
The code is translated to ANSI-C and compiled with
CodeWarrior 10.
|
|
Input - Output
You can read the following diffractogram files:
- Philips ".RD" - APD- VMS-Format
- Philips ".RD" - APD- MSDOS-Format
- Philips APD - ASCII-MSDOS-Format (APD-"View Scan")
- Philips APD - APD-UDF-ASCII-MSDOS-Format
- Siemens ".RAW" - RAW2-MSDOS-Format
- ".MDI" ASCII Text Format
- ".OUT" ASCII Text Format
- Sietronic ".CPI" ASCII Text Format
File must be a single-scan.
No more than 16768 single counts in one file.
Count limit: 327.680 (Counts higher than 32.768 will
decreased to 10%).
You can read and write:
- XToraya4Mac of H.Stanjek, Freising, TU Munich
- Text-ASCII (angle, count [, base] - several delimiters
possible)
- In MacDiff's native compact and fastest DIFF format
|
|
List of some features:
- Up to ten colored diffractograms in undependend
windows.
- Up to seven multiple diffraction profiles showing in
one diagram.
- Variable diffractogram size.
- Variable line color, size and type.
- Variable axis types (normal, inverted, square root,
logarithmical, d-spacings).
- Button strip for 20 frequently used program
functions.
- Base line removing.
- Optimized fast drawing and screen redraw.
- Mouse-sensitive zooming and scrolling.
- Cursor sensitive angle-, d-value and count display.
- High quality print, colored (if desired), optional
logo.
- Prints and saves lists of counts and and of all
measuring data.
- Import of "good-old" analog diffractogram plots via
scanner or by digitizing table.
- Export vector graphics via clipboard or by
PICT-files, also in 5 x resolution
- Editable counts and base values.
- Optional Debye-Scherrer like film image.
- Outlier and divergence filter, linear peak
correction, smoothing counts, alpha-2 stripping.
- Simple math manipulations.
- Changing K-Alpha-type on the fly.
- Recalculation to other wavelengths/K-Alpha type and
step size.
- Determination of mean diffractograms from several
profiles.
- Diffractogram subtraction.
- Base line determination by an iteration method or by
graphical manipulation.
- Base line can be saved (MacDiff file format).
- Peak analysis by double click: d-value, counts, area,
and FWHM as standard.
- Simple peak point search routines
- Labels of single peaks.
- About 30 optional peak parameter (i.e. half areas,
integral breadths).
- Implemented JCPDS-like database interface.
- Comes with a standard database holding 7500 peaks of
about 200 rock-forming minerals.
- Links a given peak to a peak database index for
identifying.
- Peak search routine, also linkable to a peak
database.
- User defined analysis program to evaluate data of up
to 32 peaks.
- Semi-automatic processing by file sessions (Batches
of up to 255 profiles).
- Reports of all peak data, exporting as TEXT-files.
- Automatic FWHM calibration of five different peaks.
|
|
Example screenshots:
 Analysis of Quartz (101) peak
|
|
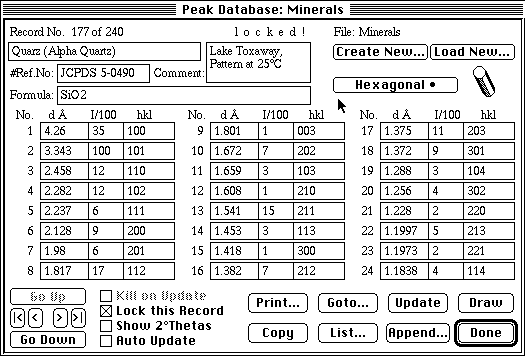
 Peak database dialog (shown here: Alpha Quartz)
|
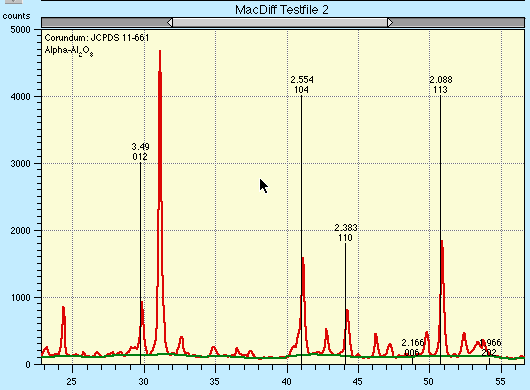
 Comparison of the measured profile with line
graphs showing reflections as available in a peak database.
Here: Detection of corundum.
|
|
|
|
|


