CHEKCELL: Graphical Powder Indexing helper and Spacegroup Assignment Software that links into the Crysfire Powder Indexing Suite by Robin Shirley
CHEKCELL now has a version of Truecell included with it under the "Cell Parameters" window. For tutorial runthroughs of Truecell in stand-alone mode, refer to the LMGP Suite Main Page
CHEKCELL can be obtained off the web at the the LMGP
(Laboratoire des Materiaux et du G�nie Physique de l'Ecole Sup�rieure de
Physique de Grenoble http://www.inpg.fr/LMGP/)
program suite site at
Sunday, 3rd December 2000: Bleeding Edge beta test versions of LMGP suite software such as Chekcell, Gretep and new programs are now available in the bleeding_edge_beta_versions/ subdirectory off the above download web addresses (wait 24 hours for the Canadian and Australian server to update). Please E-mail Lachlan Cranswick ([email protected]) with any bugs of Bleeding edge versions of the LMGP suite who will collate them and send them to the authors.
|
|
The example data file is of a cubic Y2O3 sample using Indexing results from the
Crysfire Powder Indexing Suite
by Robin Shirley. Crysfire can be run concurrently with Chekcell but this assumes you already have some trial cells from Crysfire in the Crysfire *.SUM summary file. In this demonstration, we will assign the cell manually, but use the CHEKCELL automatic spacegroup assignment option to get an indication of the best spacegroups for this sample. |
|
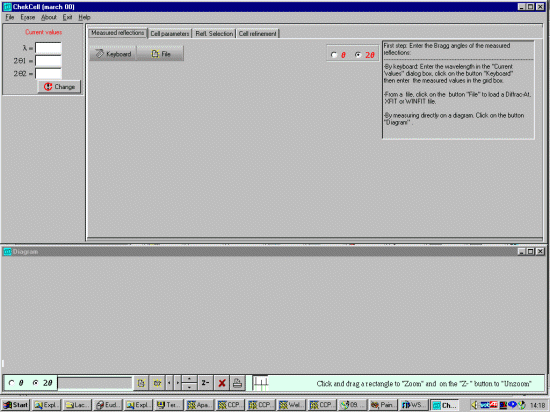
Click on the CHEKCELL icon or run the program via the windows explorer/windows file manager to
bring up the CHEKCELL starting interface.

|
|
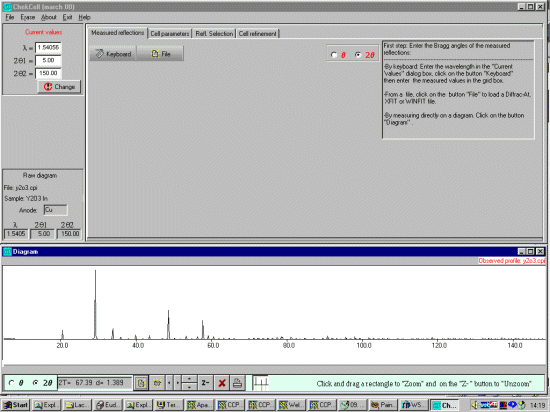
You can then open a Powder diffraction data file using either the
File, Open, Profile menu option or the the bottom left
hand set of ICONs (Chekcell can presently use Siemens/Bruker RAW, CPI or RIET7 DAT
raw datafiles). In this case we open a Y2O3.dat file. Chekcell will prompt for
the Wavelength of the peak file. Select Other and type in the wavelength: 1.54056
Angstrom (Cu k Alpha 1)
|
|
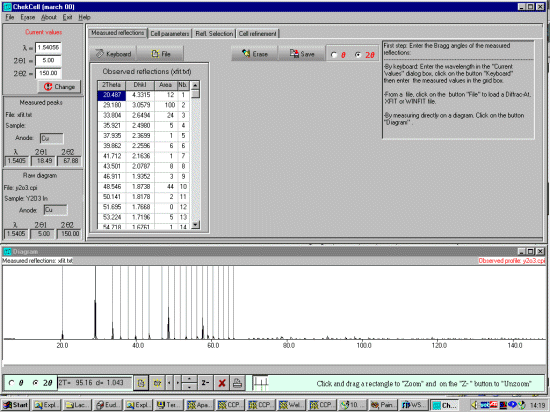
pen a peak find/peak profile file either via the File, Open, Peaks File or
the ICON under the Measured Reflections tab.
The peaks will be displayed on the bottom window. (Celref can presently import Siemens/Bruker DIF,
Winfit *.DAT, or XFIT *.TXT peak find/peak profile output files). If loading an XFIT or related file
(in this case a y2o3.txt XFIT peak profile file),
when prompted for wavelength select OTHER and confirm the
wavelength being used (1.54056 Angstrom) and continue.
|
|
At this point, you may like to zoom up this particular example so that only the
peaks that have been fitted are visible.
Select the Cell Parameters tab and select the CRYSFIRE button bringing up file open prompt to find the Crysfire *.SUM file.

Select the relevant Crysfire *.SUM file which will display the Cells summarised by Crysfire, and display the peaks expected from the first cell in the Crysfire file at the lowest symmetry spacegroup.

|
|
Clicking on another cell (in this case the 10.6 Angstrom Cubic trial cell) will
then calculate the expected lines for your graphical evaluation.
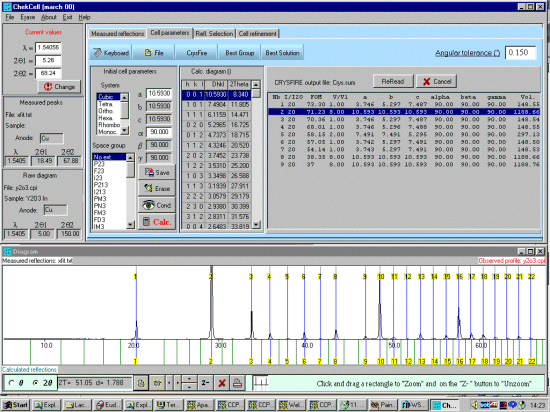
If you are still running Crysfire (and generating an updated *.SUM file), you can use the ReRead Icon to get an updated set of Trial Cells from Crysfire. |
|
When you are happy with a cell and you wish to try and determine what might
be the most appropriate spacegroups, select the Best Group Icon
and if appropraite, edit the Tolerance. Normally the default is OK.

|
|
Now select Start for ChekCell to
automatically sort the spacegroups in order of most likelyhood. In this
case it is rather unambigious on suggestion IA3 is the best
spacegroup. Which in this case happens to be correct.
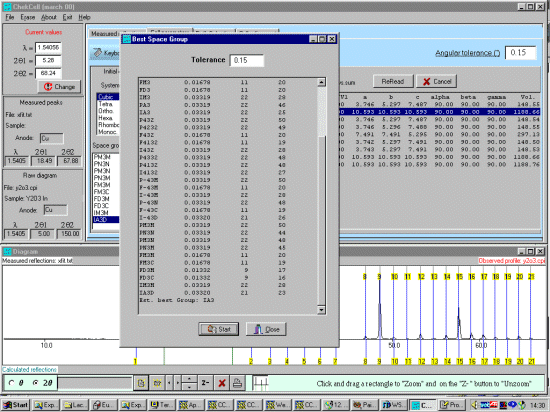
You can now browse around trying this and other spacegroups. Or try another cell. The world is your oyster! In the above case, to see what IA3 looks like on this cell, select the IA3 spacegroup from the menu.
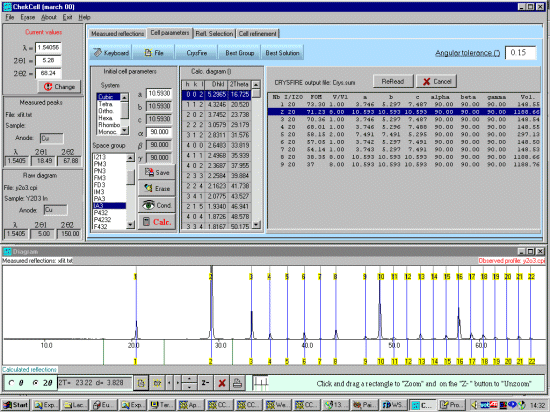
You can also graphically evaluate other spacegroups at Whim of course. |