Checking and Evaluating the Results using Chekcell
Click on the CHEKCELL icon or run the program via the windows explorer/windows file manager to bring up the CHEKCELL starting interface.
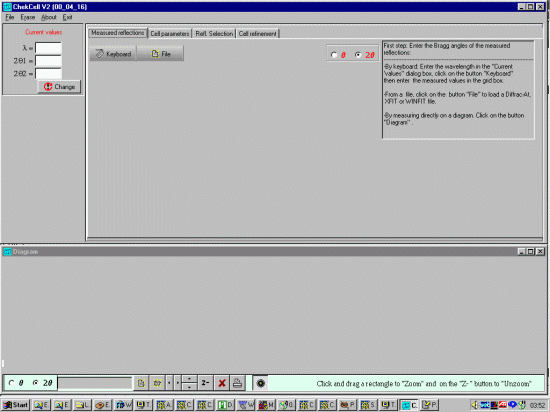
CHEKCELL: Graphical Powder Indexing helper and Spacegroup Assignment Software that links into the Crysfire Powder Indexing Suite by Robin Shirley
CHEKCELL now has a version of Truecell included with it under the "Cell Parameters" window. For tutorial runthroughs of Truecell in stand-alone mode, refer to the LMGP Suite Main Page
What is this tutorial about?Normally most users of powder indexing software would base this decisions mainly on the FOM (Figure of Merit). Chekcell performs a "Best Solution" based on the ratio of Observed to Calculated peaks for a particular cell/spacegroup combination. It can thus highlight interesting cells that may not have a high FOM, but on the basis of parsimony of excess reflections. This is one such example using a cell (in press, Ian E. Grey el al.) where the "true" cell and spacegroup was obtained via TEM (Transmission Electron Microscopy). It was originally provided to test out "automated powder indexing" methods and what it might suggest on this type of data. Thus while contrived, the main aim is to serve as a point when performing powder indexing. The True Hexagonal/Rhombohedral cell is the 166th solution from the top having an FOM of "76.6". The top solution is monoclinic (exactly 1/6th the size of the "true" cell) and has an FOM of "163.09". However, using the above mentioned Chekcell "Best Solution" option, it will suggest the user have a closer look at this cell. (It turns out that a sensible structure cannot be put into the monoclinic cell - only the hexagonal cell). To do this, the Chekcell "Best Solution" will automatically crunch through the 2,578 solutions that indexing 20 out of 20 peaks (I20=20). This takes away much of the drudge work in going through trail indexing solutions that the user might be expected to perform if Chekcell was not available. Thus Chekcell can give extra "food for thought" in scoping the range of realistic and probable cells for some types of indexing problems. The data is from a laboratory Powder X-ray diffraction instrument: Philips 1050/1710 with diffracted beam curved Graphite Monochromator; 0.2 mm receiving slit; 1 degree divergence slit; LFF Cu X-ray tube (Cu k alpha1 = 1.54056 Angstrom); 173mm Goniometer radius; slit widths= 12mm; Sample Length=12mm. The peaks were profiled with XFIT using fundamental parameters mode to obtain the most accurate peak positions. The Crysfire powder indexing suite was used to obtain and order the indexing results and Chekcell used to help interpret these.
|
Obtaining the Software Used in this tutorial
Sunday, 3rd December 2000: Bleeding Edge beta test versions of LMGP suite software such as Chekcell, Gretep and new programs are now available in the bleeding_edge_beta_versions/ subdirectory off the above download web addresses (wait 24 hours for the Canadian and Australian server to update). Please E-mail Lachlan Cranswick ([email protected]) with any bugs of Bleeding edge versions of the LMGP suite who will collate them and send them to the authors.
|
|
NOTE: If Chekcell fails to give any suggested cells, or
only seems to be analysing a very small subset of the trial cells,
make sure to check the options of the Best Solution Search
window as you may have default limits from a previous session
that are not applicable to the present problem (i.e., number of indexed
peaks, too high a figure of merit or too strick limits on maximum cell
size, etc)
(It is possible for the user to concurrently run Crysfire and import the updated *.SUM Summary file at the click of a button) |
Obtaining the Example Data to try this yourself(including XFIT, Crysfire files, and full Chekcell "Best Solution" output file) |
Select and Profile the peaks using XFITBe careful to check for possible contaminating peaks due to Cu k beta and Tungsten getting through the monochromator. Also be wary that low intensity peaks (even if due to the single main phase) are less accurately determined and could throw of the indexing programs. In the above case, recollecting the data with better counting statistics could be advisable. |
Run CRYSFIRE Powder Indexing Suite to Obtain the Indexing resultsBe careful to check for possible contaminating peaks due to Cu k beta and Tungsten getting through the monochromator. Also be wary that low intensity peaks (even if due to the single main phase) are less accurately determined and could throw of the indexing programs. In the above case, recollecting the data with better counting statistics could be advisable. Use all the applicable indexing programs inside CRYSFIRE! Even if you think one or two of the programs have already found the correct cell. In the following Crysfire Summary (not part of the present tutorials), it may look like Kohl as given a very convincing solution. But the Dicvol FOM=82.5 result is a possible "better" solution and will be produced by Chekcell as a "Best Solution". This "Best Solution" was also found by TEM to be the "True Solution".
|
Checking and Evaluating the Results using ChekcellClick on the CHEKCELL icon or run the program via the windows explorer/windows file manager to bring up the CHEKCELL starting interface.

|
|
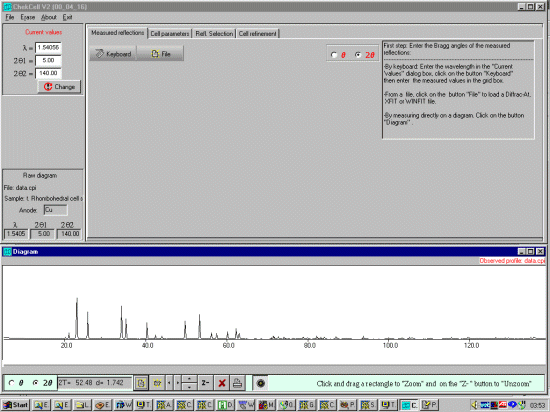
You can then open a Powder diffraction data file using either the
File, Open, Profile menu option or the the bottom left
hand set of ICONs (Chekcell can presently use Siemens/Bruker RAW, CPI or RIET7 DAT
raw datafiles). In this case we open a data.cpi file.
Chekcell will read the wavelength from the CPI file: 1.54056
Angstrom (Cu k Alpha 1)
|
|
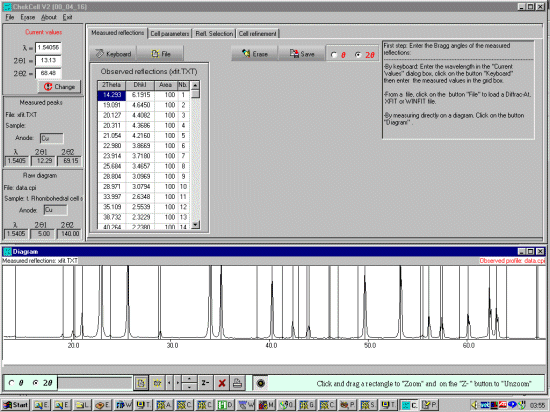
pen a peak find/peak profile file either via the File, Open, Peaks File or
the ICON under the Measured Reflections tab.
The peaks will be displayed on the bottom window. (Celref can presently import Siemens/Bruker DIF,
Winfit *.DAT, or XFIT *.TXT peak find/peak profile output files). If loading an XFIT or related file
(in this case a liti.txt XFIT peak profile file),
when prompted for wavelength select OTHER and enter the
wavelength being used to profile the peaks (1.54056 Angstrom) and continue.
|
|
Select the Cell Parameters tab and select the CRYSFIRE button bringing
up file open prompt to find the Crysfire *.SUM file.
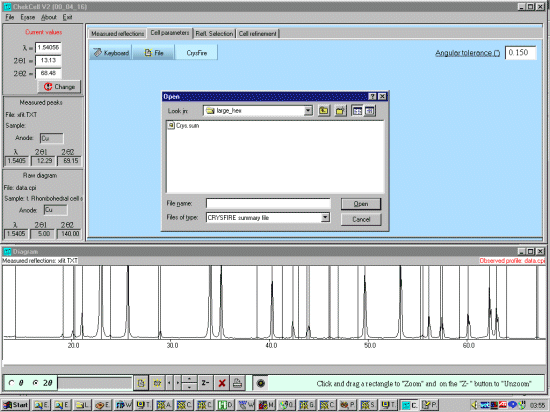
Select the relevant Crysfire *.SUM file which will display the Cells summarised by Crysfire, and display the peaks expected from the first cell in the Crysfire file at the lowest symmetry spacegroup.
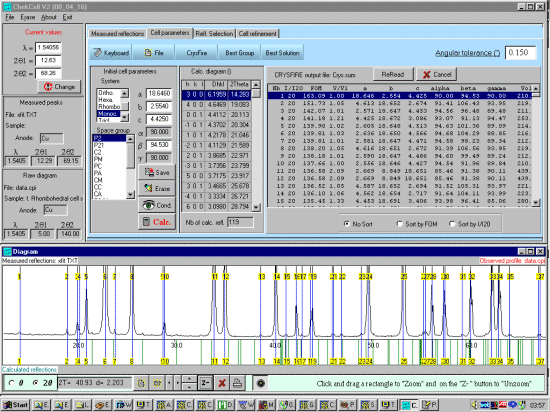
Note from the above screen dump that some of the trace unprofiled peaks seem to match up with the top FOM cells (a confidence booster that we could be on the right trace). For doing a best cell, it could be worth profiling these peaks using XFIT and add them into the XFIT.TXT file so that these can be used for Cell and Spacegroup determination within Chekcell. However, for convenience and this rather contrived demonstration, we will not do this. |
|
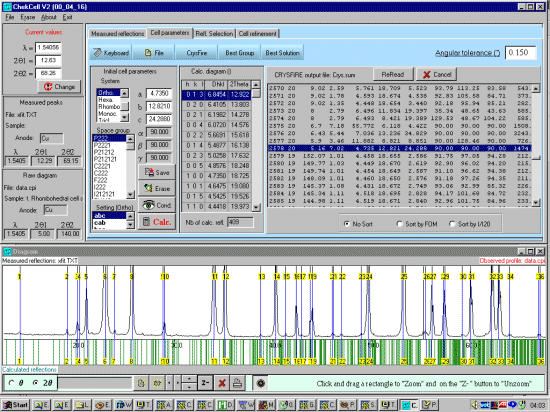
For this tutorial, scope the range of the data to see what would be
a good basis for doing the "Best Solution". There are already a
variety of good solutions that have an I20=20, so we will
ignore the I20=19 solutions. We want it to include all the cells so
we will set the default cell to be very large so it does not exclude
any.
|
|
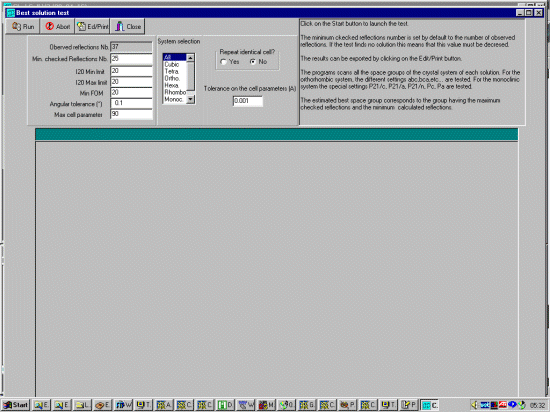
Now enter the Best Solution and set the tolerances for peforming a Cell
and Spacegroup search noting that the previous sample may have perturned the defaults.
So we will set the I20Min and I20Max tolerances that we search the cells that only indexed 20 out of 20 peaks down to an FOM (figure of merit) of 20. We will set the Max Cell Parameter to be very large (90) so this should include all practical cells. Angular tolerance is something that can be optimised but we will set this to 0.1.
|
|
Now select Run for ChekCell to
automatically sort the Cell and Spacegroups in order of most likelyhood.
(including non standard settings). (Please be patient and wait for chekcell
to finish as it summarises the best
cells/spacegroups at the end of the number crunching. Plus it is crunching
through over 1100 trial solutions).
You also view the results in Wordpad and cut and paste into other applications.
In this case it suggests an Hexagonal/Rhobohedral cell based on the parsimony of .
Chekcell then suggests that the 166th Solution with FOM=76.6; a volume of 1260.443; a Volume ratio compared to the top cell, V/V1=6.00 and cell of 5.1089 5.1089 55.7630 90.000 90.000 120.000 is the best "Best estimated group(s)": as R3, R-3, R32, R3M, R-3M giving 37 Indexed to 93 Calculated peaks. (Chekcell output file: only for the Hexagonal/Rhobohedral cell) This is compared to the monoclinic cellwith an FOM=163.09 (cell of 18.6457 2.5543 4.4247 90.000 94.534 90.000) "Best estimated group(s)": P2, PM and P2/M giving 37 Indexed to 142 Calculated peaks. (Chekcell output file: only for the Monoclinic cell) Thus this can give extra thought on what is the possible true cell. As TEM was employed here, there is not much doubt that this Hexagonal/Rhobohedral cell is correct; but TEMs may not always be practical or available. |
|
The High FOM Monoclinic Cell in P2/M fit follows:
The Medium FOM Hexagonal/Rhombohedral Cell in R-3 fit follows:
|