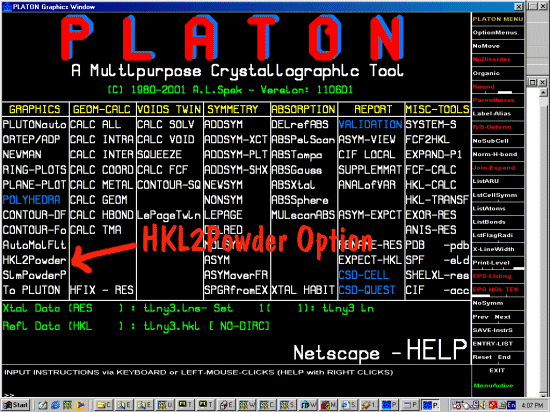
Type platon filename.ins to give the following screen, then select HKL2Powder from the menu.
(Platon gives much better graphics than the following resized screen images from a Windows X-emulation)

|
Note: HKL2Powder is only available in versions of Platon released after 11th June 2001.
There may be several reasons why you would want to convert your single crystal HKL data to a pseudo-powder pattern: a) you may wish to perform a powder style search-match phase identification on the data; b) see how the single crystal data compares with a bulk powder diffraction scan; c) use the derived powder data for indexing (due to a possible twinned cell); d) or as an indexing or general teaching exercise. In this example, we will be converting the HKL data of Tetracycline hydrochloride into a pseudo-powder pattern using Platon's HKL2Powder; then compare the HKL2Powder generated powder pattern with a laboratory powder X-ray diffraction pattern of the bulk Tetracycline hydrochloride. To run HKL2Powder, platon does not require the INS file to have atomic co-ordinates.
Some extra comments about HKL2Powder by Ton SpekTo: [email protected] (Lachlan Cranswick) Date: Sun, 10 Jun 2001 13:26:21 +0200 (MET DST) From: [email protected] (a.l.spek) * - Unless your dataset is triclinic, some symmetry info should be present in .ins. Data are first averaged into a unique dataset corresponding to the centrosymmetric Laue group associated with the supplied spacegroup info (thus 2/m for P21) Subsequently, a half sphere of reflections is generated (also written to .hkp) * - The number of missing reflections with sin(theta)/lambda < 0.3 is reported. Best wishes Ton
|
|
This assumes you have an INS and corresponding HKL file.
Type platon filename.ins to give the following screen, then select HKL2Powder from the menu. (Platon gives much better graphics than the following resized screen images from a Windows X-emulation)
|
|
On selecting HKL2Powder, the following style of powder pattern will be generated. You have various options to change the wavelength, peak widths and ranges.
|
|
Manipulate the HKL2Powder options to obtain the required screen view. A CPI powder diffraction pattern (filename.cpi) will be generated automatically; and a EPS postscript plot can be obtained on demand. If using the Windows port of Platon, select EXIT to get out of HKL2Powder; not END.
|
|
Converting the HKL2Powder generated CPI file to other file formats(Also, note that on earlier versions of HKL2Powder, the CPI powder diffraction file was given the name of filename.hks. If you cannot find a CPI file, investigate the hks file - and consider upgrading your version of Platon). Refer to Data Conversion for Powder Diffraction for available programs that can convert CPI files to other formats. Programs that can convert CPI files to other formats include:
If you need to get rid of any leading spaces (or remove all spaces) on any converted files; this can be easily done in PFE for Windows using the "Replace" option (F3 function button). To get rid of all the spaces in UNIX vi, use the following replace command: :.,$s/\ //g (space after the "\")
|
|
Comparing HKL2Powder Data with laboratory powder diffraction data
Note: The single crystal data was collected in a cryostream at liquid nitrogen temperatures; so it can be expected that there will be a differing unit cell from powder diffraction data of a bulk sample collected at room temperature.Use your favourite powder diffraction display program to overlay the two files. The following screen images are from the XFIT for MS-Windows software. The Tcl/TK based CMPR for Windows/UNIX by Brian Toby would be a UNIX program that could be used. You will note from the following screen images that there is quite an offset though the intensities give a good match (though the lowest angle HKLs were missing in the single crystal data). This offset can be explained by the differing UNIT Cells of the bulk diffraction sample vs the 30x20x10 micron single crystal from which the single crystal data was collected; most likely to the different temperatures under which the respective samples were collected under. When doing this style of comparison, also be careful to check and take into account the possibly differing wavelengths of the respective datasets.
Chekcell/Celref screen images at the bottom of this webpage show that there is a good match with the peaks when the refined unit cell is given for each sample data. (The blue data with peak asymmetry is the laboratory data; while the red data with sharp symmetrical peaks is the Platon-HKL2Powder generated data)
|
|
Chekcell / Celref screen UnitCell refinement screen imagesYou can quickly use Chekcell or Celref unit cell refinement software to graphically check the Unit Cells of the diffraction datasets.
Platon's HKL2Powder outputted pseudo-powder data inside Chekcell - Celref
Laboratory powder X-ray diffraction data of the bulk sample inside Chekcell - Celref
|
|
To compare intensities, insert the unit cell constants obtained from the powder pattern into the Shelx INS file prior to running platon
|